Topic: Separator Shaft's Spacers Layout by Frequency
Author: Jose Vasquez
Date: 12/13/2021
Spacers used for the separator shafts are placed on rackets without a specific order. While working alongside the operators, I noticed that the 100 mm spacers was placed on the racket on the far right of the table while the 80 mm spacers were placed on the far left of the table. These spacers are commonly used and thus operators are forced to constantly go to one end of the table and then immediately walk to the other end of the table to reach for the other spacer. Below is the data gathered and the proposed solution for this problem.
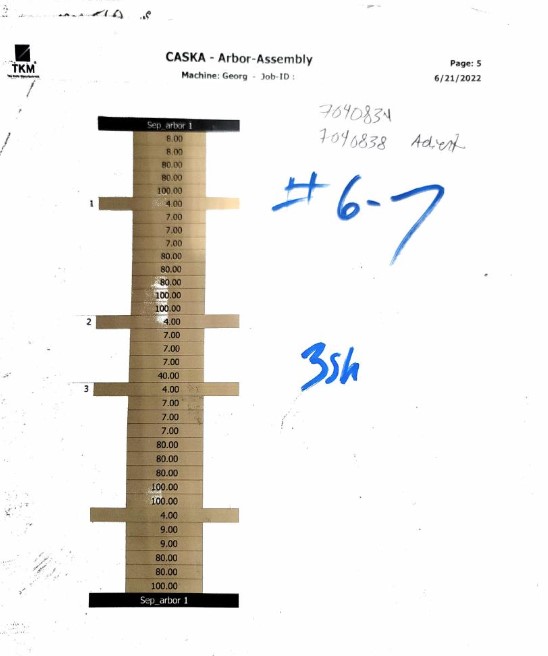
Data was collected by saving the "CASKA - Arbor Assembly" paperwork for 2 weeks. A picture of the CASKA - Arbor Assembly sheet is shown to the right. The data was gathered and input into an Excel sheet that I created. The data is located on Sheet3 called "Shaft_Spacer_Raw_Data". The Excel sheet can be found at: B:/public/Slitter Team/GI - Spacer_Shaft_Arrangement.xlsx
# Below is the first 5 rows of data from the excel sheet
import pandas as pd
import matplotlib.pyplot as plt
import nbconvert
import numpy as np
df = pd.read_excel("GI - Spacer_Shaft_Arrangement.xlsx", sheet_name="Shaft_Spacer_Raw_Data")
df.head(5)
shaft 1 | shaft 2 | shaft 3 | shaft 4 | shaft 5 | shaft 6 | shaft 7 | shaft 8 | shaft 9 | shaft 10 | shaft 11 | shaft 12 | shaft 13 | shaft 14 | shaft 15 | shaft 16 | shaft 17 | shaft 18 | shaft 19 | shaft 20 | |
---|---|---|---|---|---|---|---|---|---|---|---|---|---|---|---|---|---|---|---|---|
0 | 7.0 | 6.0 | 7.0 | 5.0 | 8.0 | 7.0 | 20.0 | 8.0 | 9.0 | 7.0 | 7.0 | 9.0 | 8.0 | 7.0 | 5.5 | 7.0 | 8.0 | 7.0 | 9.0 | 8.0 |
1 | 8.0 | 6.0 | 7.0 | 40.0 | 9.0 | 7.0 | 4.0 | 4.0 | 9.0 | 7.0 | 8.0 | 7.0 | 8.0 | 8.0 | 5.5 | 8.0 | 40.0 | 8.0 | 10.0 | 8.0 |
2 | 8.0 | 80.0 | 8.0 | 5.0 | 7.0 | 20.0 | 5.0 | 5.0 | 80.0 | 80.0 | 8.0 | 7.0 | 100.0 | 8.0 | 40.0 | 8.0 | 4.0 | 8.0 | 4.0 | 10.0 |
3 | 40.0 | 100.0 | 40.0 | 40.0 | 20.0 | 40.0 | 20.0 | 20.0 | 80.0 | 80.0 | 80.0 | 8.0 | 4.0 | 40.0 | 80.0 | 80.0 | 8.0 | 100.0 | 5.0 | 40.0 |
4 | 8.0 | 100.0 | 100.0 | 100.0 | 40.0 | 4.0 | 4.0 | 4.0 | 80.0 | 4.0 | 80.0 | 100.0 | 5.5 | 80.0 | 100.0 | 4.0 | 8.0 | 100.0 | 100.0 | 80.0 |
# getting list of all column names
shaft_number = list(df.keys())
# getting list of all spacers names
spacers = {'5.0':0,'4.0':0, '5.5':0, '6.0':0, '7.0':0, '8.0':0, '9.0':0, '10.0':0, '20.0':0, '40.0':0, '80.0':0, '100.0':0}
spacer_value = list(spacers.keys())
# counting number of spacers used (frequency)
for j in shaft_number:
a = (df[j].value_counts()).to_dict()
b = list(a.keys())
for i in b:
spacers[str(i)] = spacers[str(i)] + a[i]
# Getting rid of unnecessary separator 4mm rings
spacers.pop('4.0')
#spacers_frequency = pd.DataFrame([spacers]).transpose()
# Creating and displaying bar graph and table
x_value = list(spacers.keys())
y_value = list(spacers.values())
t1 = plt
t1.xlabel('Spacer size (mm)')
t1.ylabel('# of Spacers')
t1.title('Frequency of Each Spacer Used')
t1.bar(x_value, y_value)
t1.show()
print("Above is the bar graph for the 'Frequency of each Spacer used' \nBelow is the data arranged in Descending order")
rank_order = pd.DataFrame(sorted(spacers.items(), key=lambda x: x[1], reverse=True))
rank_order.columns = ['Spacer Size', '# of Spacers (frequency)']
rank_order
Above is the bar graph for the 'Frequency of each Spacer used' Below is the data arranged in Descending order
Spacer Size | # of Spacers (frequency) | |
---|---|---|
0 | 8.0 | 102 |
1 | 100.0 | 96 |
2 | 7.0 | 77 |
3 | 5.5 | 72 |
4 | 80.0 | 67 |
5 | 20.0 | 44 |
6 | 40.0 | 40 |
7 | 5.0 | 27 |
8 | 6.0 | 16 |
9 | 10.0 | 13 |
10 | 9.0 | 12 |
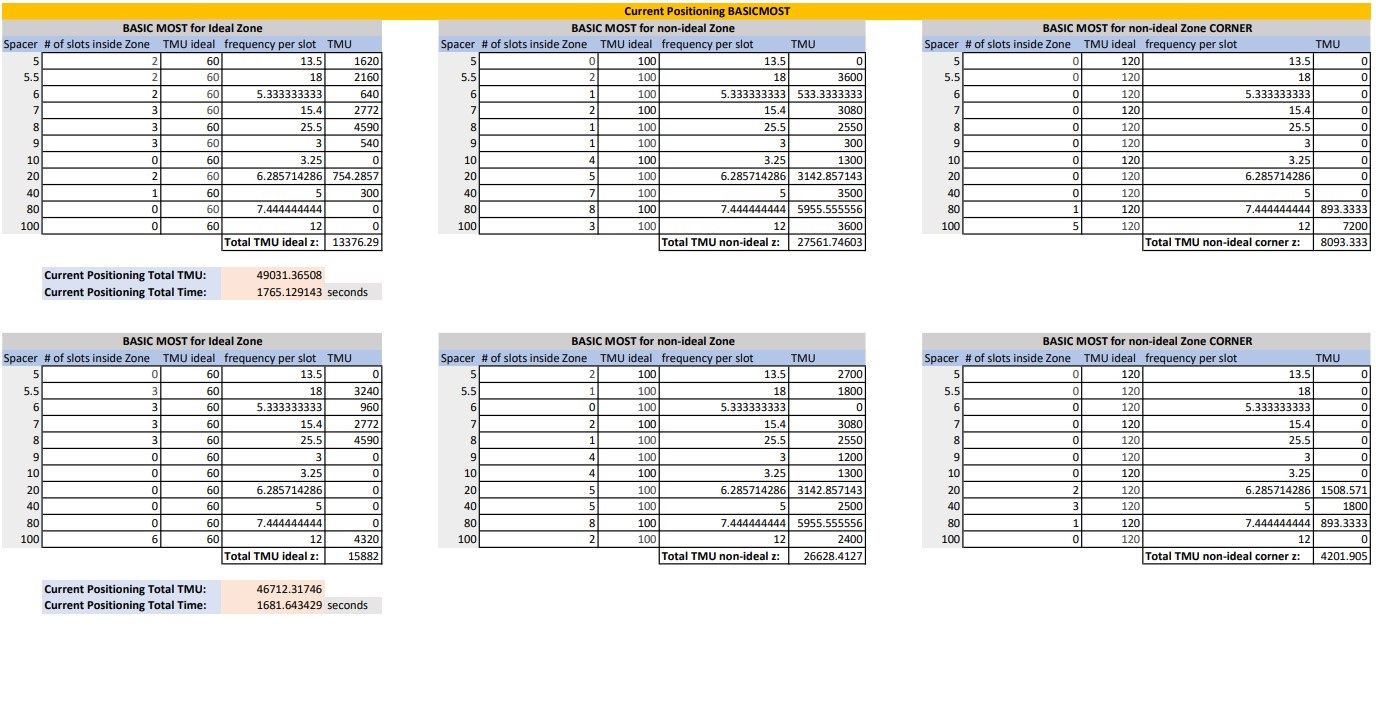
Using this information, I used BasicMOST to calculate the current position of the spacer's TMU and a proposed layout of the spacers on the rack TMU. The tables were done in Excel and can be found on:
B:/public/Slitter Team/GI - Spacer_Shaft_Arrangement.xlsx
The current layout of the position of the Spacers on the rack are as follows:
# extracting data
current_position = pd.read_excel("GI - Spacer_Shaft_Arrangement.xlsx", sheet_name="Frequency_Spacer_Graph", skiprows=23, usecols="B:S", header=0, index_col=0).head(5)
xposition=list(current_position.keys())
yposition=list(current_position.index)
# modifying data to get "cool" colors for most frequent and "warm" colors for less frequent
# cleaning data: replacing all string x and blade with nan
current = current_position
current = current.replace('x', np.nan)
current = current.replace('blade', np.nan)
# making all values inside data to float
current = current.astype(float)
# giving weighted value to each spacer depending on frequency order
spacer_size = list(rank_order["Spacer Size"])
spacer_size = list(np.float_(spacer_size))
current = current.replace(spacer_size, [0,5,10,15, 50,60,70,80,100,150,200])
current = current.replace([200.0, 300.0], [200, 200])
# convert to array to add to heat map / table
current = np.array(current)
current_position = np.array(current_position)
# plotting heat map / table
ax =plt
ax.subplots_adjust(left=0.5, bottom=0.7)
ax.figure(figsize=(11, 9))
ax.imshow(current, cmap='cool',interpolation="nearest")
ax.figure(figsize=(9, 0.7))
ax.axis('off')
ax.table(cellText=current_position,colLabels=xposition, rowLabels=yposition, loc="bottom")
plt.show()
<Figure size 640x480 with 0 Axes>
Below is an "image" of the current position done in Excel
The calculated TMU is shown below:
Current Position TMU: 49031.36508
Current Position Time: 1765.129143 seconds
The Proposed and improved position is shown below:
The heatmap showing the improvement is shown below:
# extracting data
proposed_position = pd.read_excel("GI - Spacer_Shaft_Arrangement.xlsx", sheet_name="Frequency_Spacer_Graph", skiprows=42, usecols="B:S", header=0, index_col=0).head(5)
xposition=list(proposed_position.keys())
yposition=list(proposed_position.index)
# modifying data to get "cool" colors for most frequent and "warm" colors for less frequent
# cleaning data: replacing all string x and blade with nan
current = proposed_position
current = current.replace('x', np.nan)
current = current.replace('blade', np.nan)
# making all values inside data to float
current = current.astype(float)
# giving weighted value to each spacer depending on frequency order
spacer_size = list(rank_order["Spacer Size"])
spacer_size = list(np.float_(spacer_size))
current = current.replace(spacer_size, [0,5,10,15, 50,60,70,80,100,150,200])
current = current.replace([200.0, 300.0], [200, 200])
# convert to array to add to heat map / table
current = np.array(current)
proposed_position = np.array(proposed_position)
# plotting heat map / table
ax =plt
ax.subplots_adjust(left=0.5, bottom=0.7)
ax.figure(figsize=(11, 9))
ax.imshow(current, cmap='cool',interpolation="nearest")
ax.figure(figsize=(9, 0.7))
ax.axis('off')
ax.table(cellText=proposed_position,colLabels=xposition, rowLabels=yposition, loc="bottom")
plt.show()
<Figure size 640x480 with 0 Axes>
The calculated TMU is hown below:
Proposed Position TMU: 46712.32
Proposed Position Time: 1681.643 seconds
Comparison with Old position:
Current Position TMU: 49031.36508
Proposed Position TMU: 46712.32
Current Position Time: 1765.129143 seconds
Proposed Position Time: 1681.643 seconds
Calculated Approx. Saved time: 83.48571 seconds